Humans have been watching the sky for immemorial times. They built astronomical observatories used for setting yearly calendars. This full 3-dimensional view would be the base of a cosmography showing celestial objects and deities. The first description of this kind was provided by Homer on the “great and sturdy shield” made by Hephaestus for Achilles (Illiad, 18, 484-609). It even showed both time and space on the same picture, thus linking Homer and Einstein to each other. However, it proved to be more difficult to describe the earth floor.
After travelling the world, the ancients felt a need to put their knowledge into a simple overall view. They first looked for the borders of the inhabited world (oikoumene) and described it as a circular island in the middle of an external ocean according to the Homeric concept that survived two millennia until the Middle Ages. Anaximander of Miletus is considered to be the first to design a map of the world around 550 BC. He was followed by Hecataeus, also from Miletus (Geus, 2018).
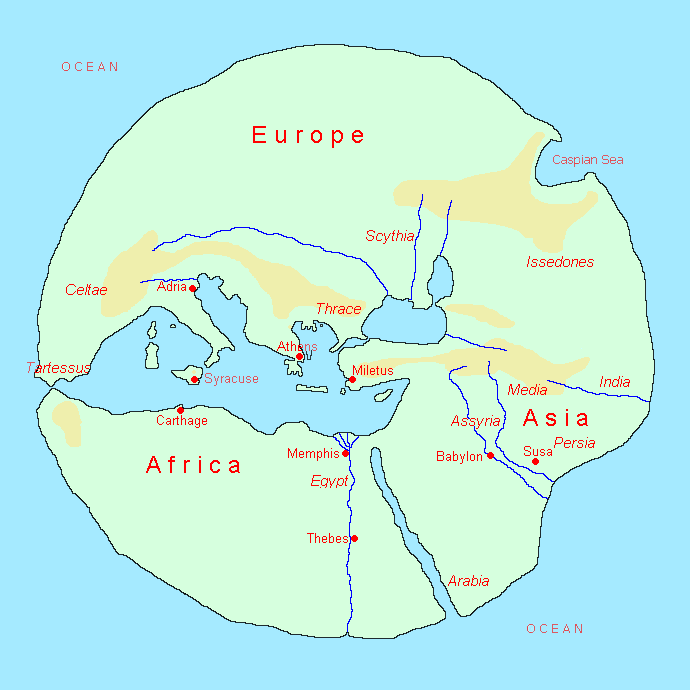
(http://www.livius.org/concept/the-edges-of-the-earth-1/the-edges-of-the-earth-2/)
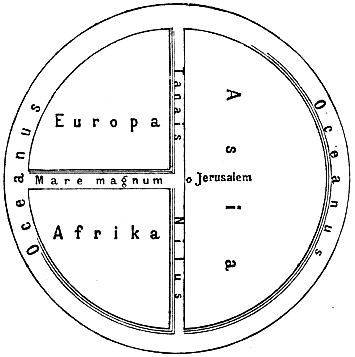
In the wake of Ephorus’ description of the oikoumene (ca. 350 BC), Eratosthenes came with a rectangular shape (around 200 BC) that was not widely adhered to until much later (Cosmas Indicopleustes around 550 AD). Meanwhile, the simplified ‘T-O’ scheme was widely used, possibly based on Lucan’s description (Pharsalia, Book 9, verse 411, around 60 AD, acc. to P. Arnaud, 1990, p 283):
Thanks to Eratothenes, and to Pythagoras before him, the ancients realised that the oikoumene was located on the surface of a sphere (3-dimensional) and that putting this on paper (2-dimensional) would require some kind of geometrical projection. Strabo suggested that such a map would be shown best on a 10 feet diameter globe (Strabo, Geogr., 2, 5, 10, around 10 BC). This was not only a very large object, but it was also quite useless, as the oikoumene covered only a small part of its surface. A good reason why none survived (if such a globe was ever built).
Having set the borders of the oikoumene, the ancient cartographers had to add more information about landscapes (e.g. rivers and mountains) and human settlements (cities and peoples) e.g., the map of Aristagoras (Herodotus, Hist., 5, 49). This appeared to be a problem simply because the maps had to be large enough to host that much information. Hence, such maps had to be monumental wall-maps (‘pinax’ or ‘tabula’ on a large wall or floor). Another option was to distort the maps to include this information, e.g. increase the size of densely populated areas and reduce the size of deserts (see Ptolemy, Geography, 8, 1).
Clearly, geography had to combine several needs, out of which choices had to be made:
- accuracy of land contours and place location (cartography),
- volume of information concerning rivers, mountains and cities (chorography),
- description of territories concerning climates, inhabitants, etc. (climatology, human geography),
- pictures showing real landscapes (painting or mosaic like the Haidra one in Tunisia),
- encompassing the whole oikoumene,
- to be beautiful.
Many cartographers (possibly including Agrippa) also had a political approach trying to show an impressive number of conquered cities and tribes to please a proud emperor. Others denied the existence of a livable world in the southern hemisphere, despite accounts of sailors (Strabo, Geogr. 2, 5, 3 & Pliny, NH, 6, 39). As a matter of fact, many maps had a hidden agenda, while Ptolemy just had a scientific approach looking for an accurate map. The answer found by Ptolemy (around 160 AD) and his predecessors (Dicaearchus around 300 BC and Marinus of Tyre around 100 AD) by suggesting subdividing the world into parallelograms defined by meridians and parallels, introduced the idea of modern atlases. However, his idea could only be put into practice when the ancient papyrus scroll (volumen, several meters long, but with no more than 25 to 35 cm height) was replaced by the larger parchment codex (menbrana, with a maximum size of up to 70 x 40 cm) around the 6th c. in Europe, although it was already used in Asia Minor during the Hellenistic period. Only then could drawn maps really start to replace the textual maps used in Antiquity.
In addition, ancient texts and maps had to be copied at regular intervals to be preserved over time. This was done by more or less knowledgeable people who often tried to ‘improve’ the document by adding or changing information. The maps resulting from this process were therefore closer to an ‘evolution’ than to a simple copy.
Only four world-maps (‘mappaemundi’) dating before year 1000 were found to date (Arnaud, 2014):
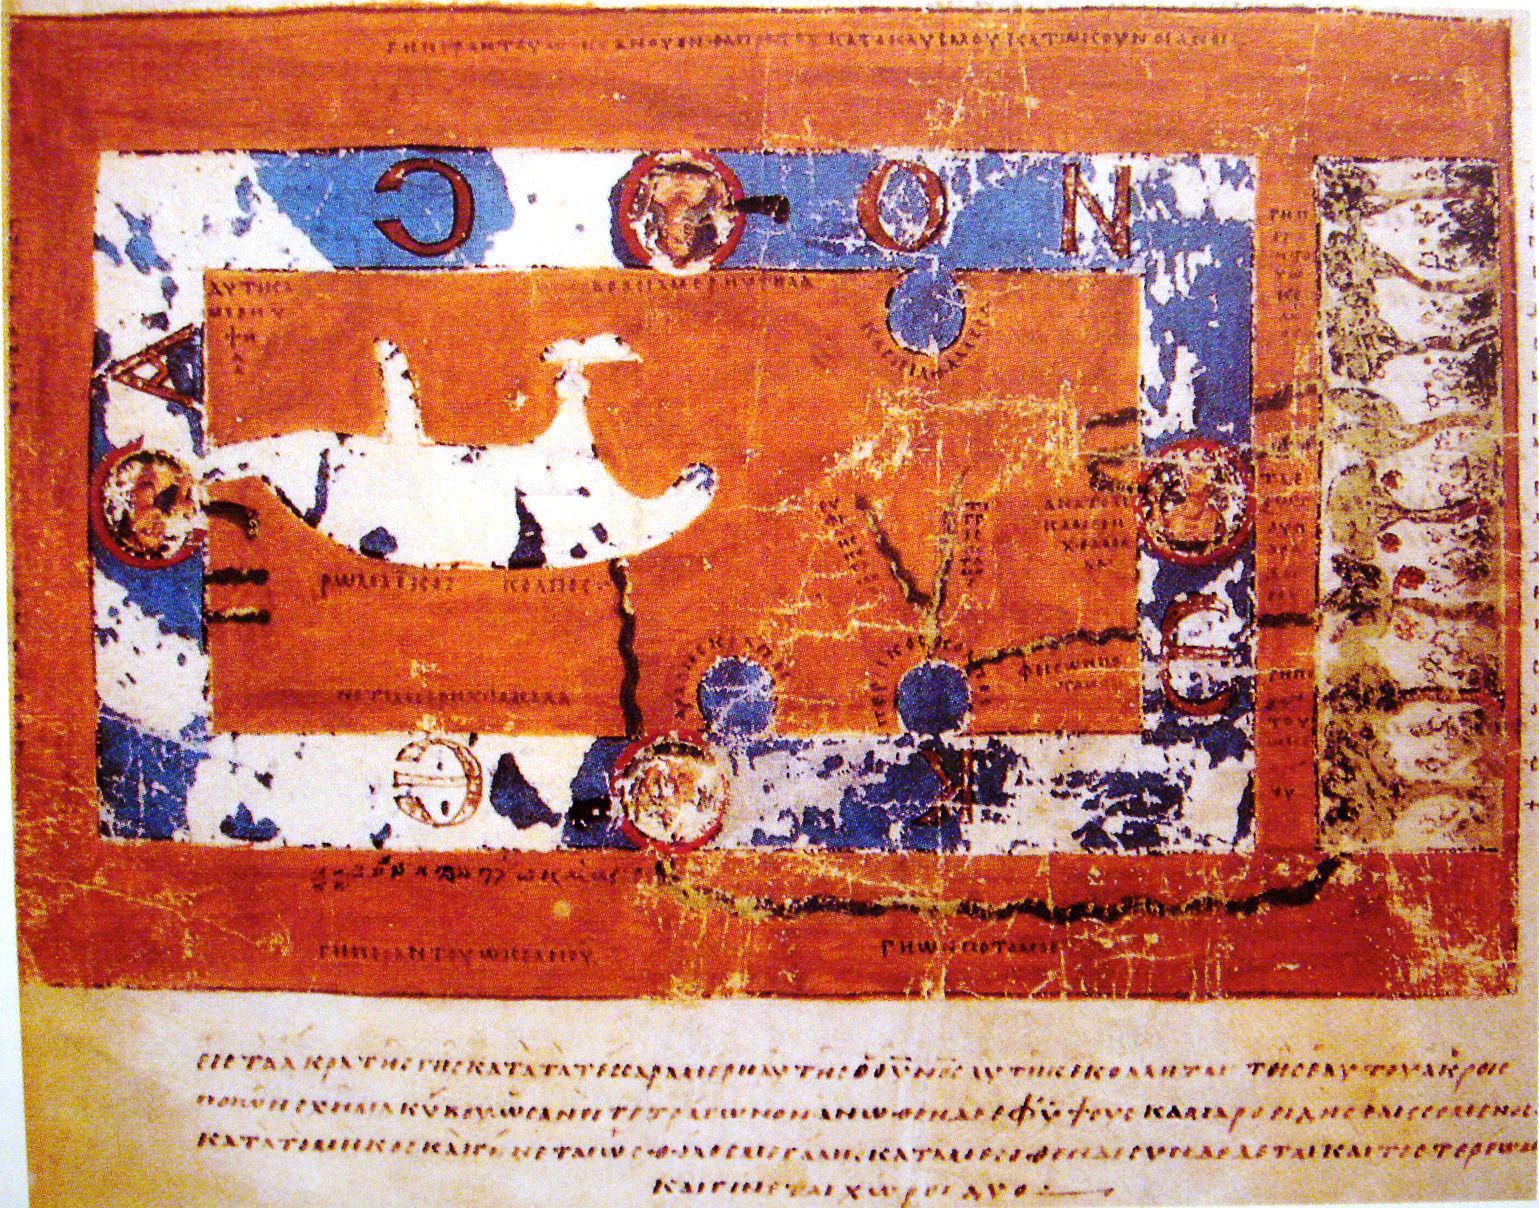
Mappa mundi by Beatus de Liebana, 8th c., from an 11th c. copy
(0.367 x 0.286 m, top is east) (BnF, Latin Manuscripts 8878, f. 45v-46).
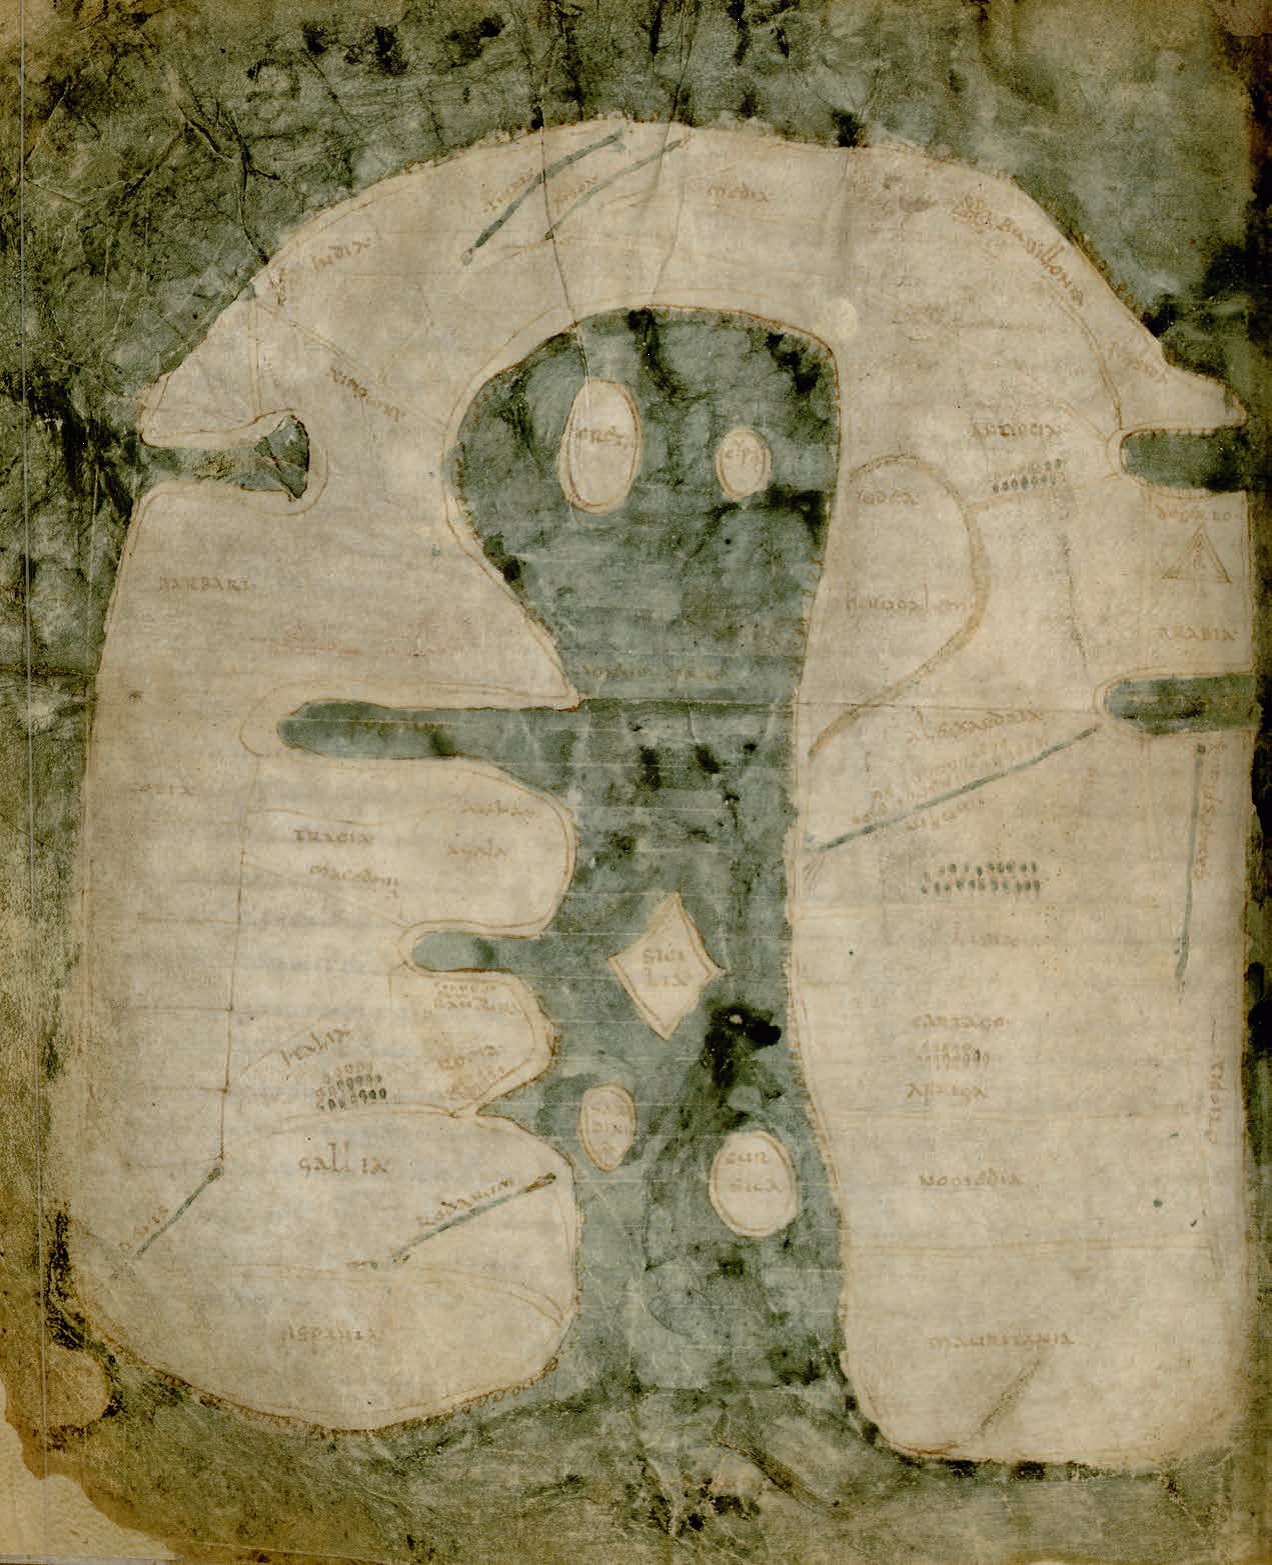
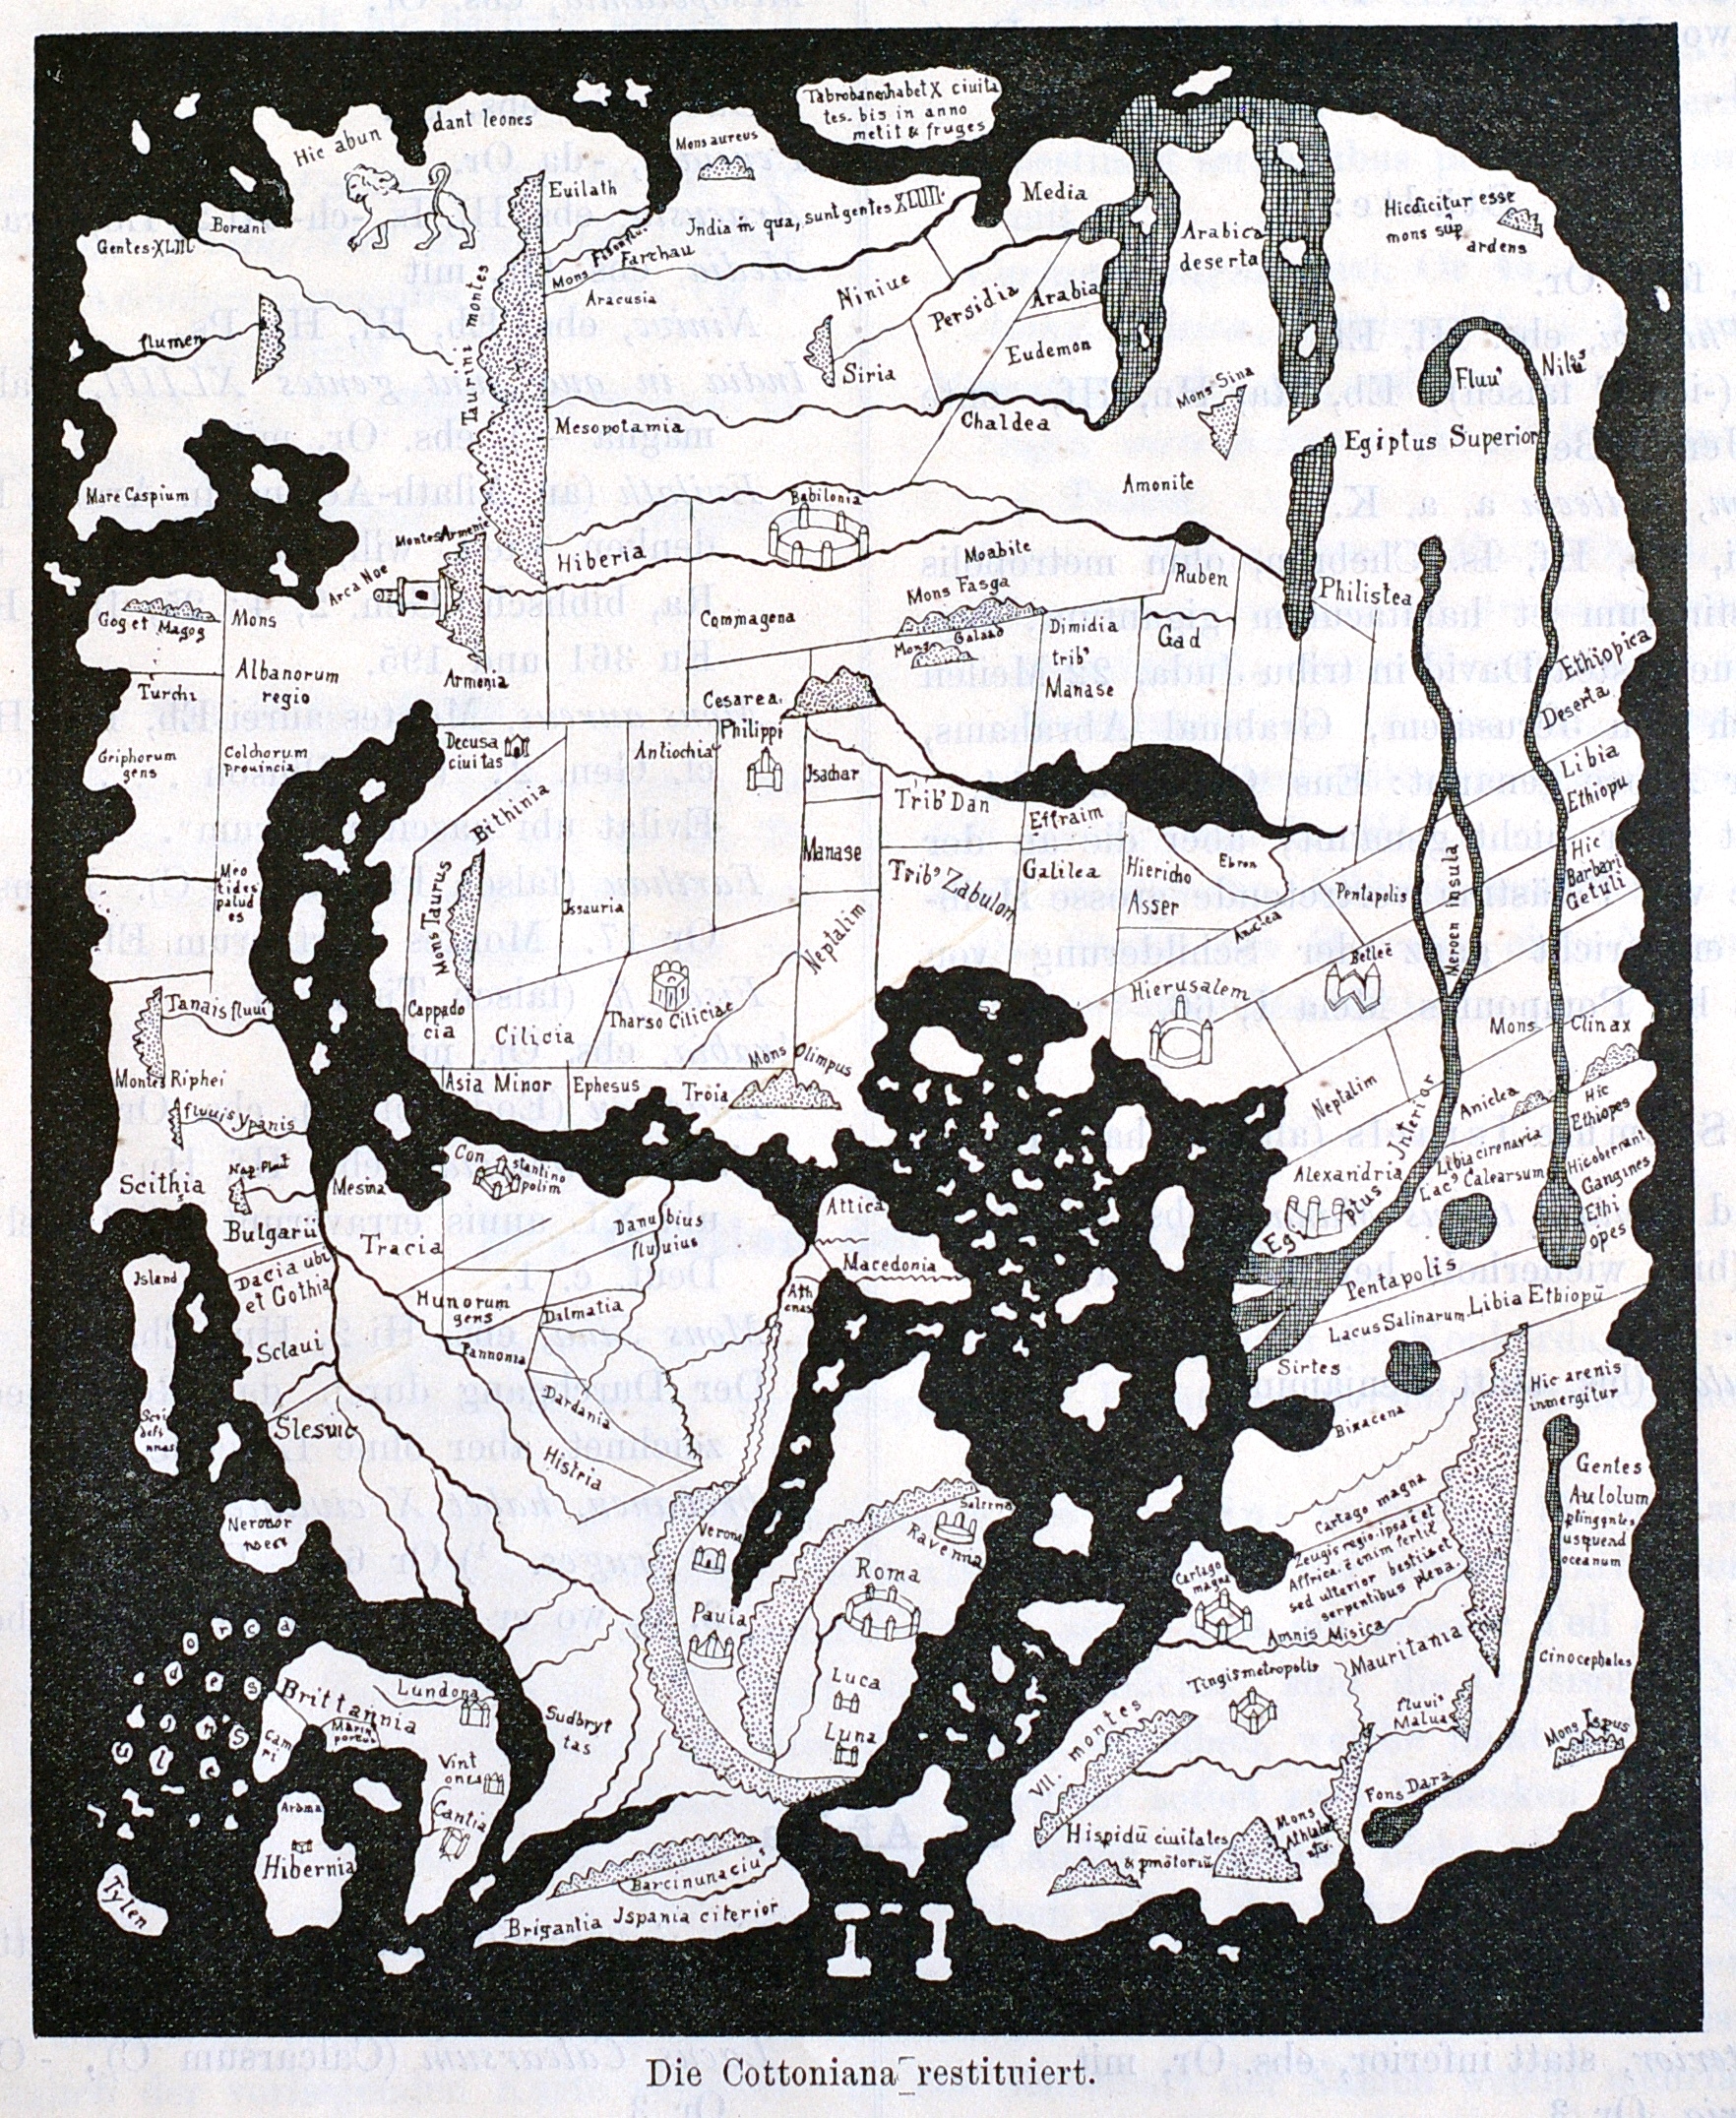
All other ‘ancient’ maps we can see today were redrawn based on ancient texts without any drawings: e.g., the remains of the ‘map’ of Agrippa consist of text only and his monumental Porticus Vipsania did not survive (if it was ever built). Agrippa’s work is dated around 15 BC and mentioned by Pliny around 77 AD. It was probably used for the Cottoniana around 1000 AD and used at Ebstorf around 1235 AD and Hereford around 1300 AD (Arnaud, 1990, p 1279-1298).
This is also the case for all maps based on Ptolemy’s tables of coordinates, which were forgotten for a long time, which reappeared in Constantinople around 1300 AD thanks to Maximus Planudes, and which proved to be (by far) the best representation of the oikoumene until the Middle Ages.
Information provided by ‘itineraries’ written by travellers surely had a lot of influence on these maps, even if this information could not be retrieved as such on them (Arnaud, 2007).
The famous Peutinger map (Tabula Peutingeriana) from the 13th c. was found in 1507 by Conrad Celtis and given to his friend Konrad Peutinger in 1508. In contrast with the maps mentioned above, it might be called ‘1-dimensional’ because of its distorted and linear aspect fitting the ancient scrolls (the size of the Peutinger map is 0.34 x 6.75 m). The Peutinger map can perhaps be seen as the outcome of a long evolution of itineraries. It was probably based on late 4th c. Roman itineraries (Emperor Julian the Apostate, acc. to Arnaud, 1990, p 945 & 916), themselves inspired by others such as the much older Scylax of Caryanda (around 515 BC, acc. to Wikipedia), Pseudo-Scylax (around 330 BC, acc. to Wikipedia), Nearchus (325-324 BC), the Stadiasmus Maris Magni (around 150 to 50 BC?), Pseudo-Scymnos (between 133 and 110 BC, acc. to Marcotte, 2000) and the Antonine Itinerary (around 350 AD, for the non-maritime parts, and between the 4th and the 6th c. AD for the maritime parts, acc. to Arnaud, 2004).
Portolans provide information for seafarers sailing from port to port. A portolan consists of a marine chart with port names and 16 or 32 ‘rhumb lines’ (directions at 22.5° or 11.25° angles), and of written nautical instructions. Some charts are still available: the oldest known chart is the “Carta Pisana” dated slightly before 1300 AD and possibly using information from “Lo compasso da navigare” (13th c.). The oldest known portolan (but the chart is missing) is the “Liber de Existencia Riverierarum et Forma Maris Nostri Mediterranei” dated around 1200 AD and studied by Patrick Gautier-Dalché in 1995. Note that early portolan charts were drawn before Ptolemy’s coordinate system was rediscovered around 1300 AD. The surprising accuracy of portolans is probably linked to the use of the compass, which was already in use in the early 12th c., and using dead reckoning and triangulation.
One might say that both Eratosthenes and Ptolemy had it right from the onset, but that it took a millennium or so, to have their vision of a spherical oikoumene widely accepted. It was Gerardus Mercator who brilliantly combined portolan charts with Ptolemy’s system in 1569.
We may perhaps summarize by saying that:
travellers had a mostly linear (1-dimensional) perception of the world,
geographers (‘chorographers’) had a planar (2-dimensional) view, and
astronomers (‘geographers’) had a spherical 3-dimensional view.
But all of them seem to have been badly limited in their capacity of drawing maps
and relied mainly on textual descriptions of their world.
(Arnaud, 1990, p 1299-1307)
Eventually, the problem of a single map including all information was solved in 2004 by Google Earth’s revolutionary zooming tool.
References
- ANCIENT MAPS by Jim Siebold: http://www.myoldmaps.com
- WIKIPEDIA: http://en.wikipedia.org/wiki/Early_world_maps
- LIVIUS: http://www.livius.org/concept/the-edges-of-the-earth-1/
- CARTOGRAPHY Unchained: http://www.cartographyunchained.com/
- MAP HISTORY: http://www.maphistory.info/
- ORANGE: http://www.archeo-rome.com/orange/orange01.html
- DURA-EUROPOS: http://en.wikipedia.org/wiki/Dura-Europos_Route_map
- MADABA Mosaic: https://en.wikipedia.org/wiki/Madaba_Map
- COTTONIANA Map: http://swanrad.ch/mappae-mundi-from-the-edition-of-konrad-miller/
- HEREFORD Map: https://www.youtube.com/watch?v=uO-IJUP_UBQ
- EBSTORF Map: http://en.wikipedia.org/wiki/Ebstorf_Map