The best I can do to summarise the complex subject of secular ‘Sea Level Change’ (SLC) is to start with Wikipedia (note that here, we define time as BP, ‘Before Present’, i.e., with a 1950 year shift compared to BC):
“Global or eustatic sea level [now called “barystatic Sea-Level”] has fluctuated significantly over the earth’s history. The main factors affecting sea level are the amount and volume of available water and the shape and volume of the ocean basins. The primary influences on water volume are the temperature of the seawater, which affects density, and the amounts of water retained in other reservoirs like rivers, aquifers, lakes, glaciers, polar ice caps and sea ice. Over geological timescales, changes in the shape of the oceanic basins and in land/sea distribution affect sea level. In addition to global changes, local changes in sea level are caused by the earth’s crust uplift and subsidence.”
Last Glaciation Cycle
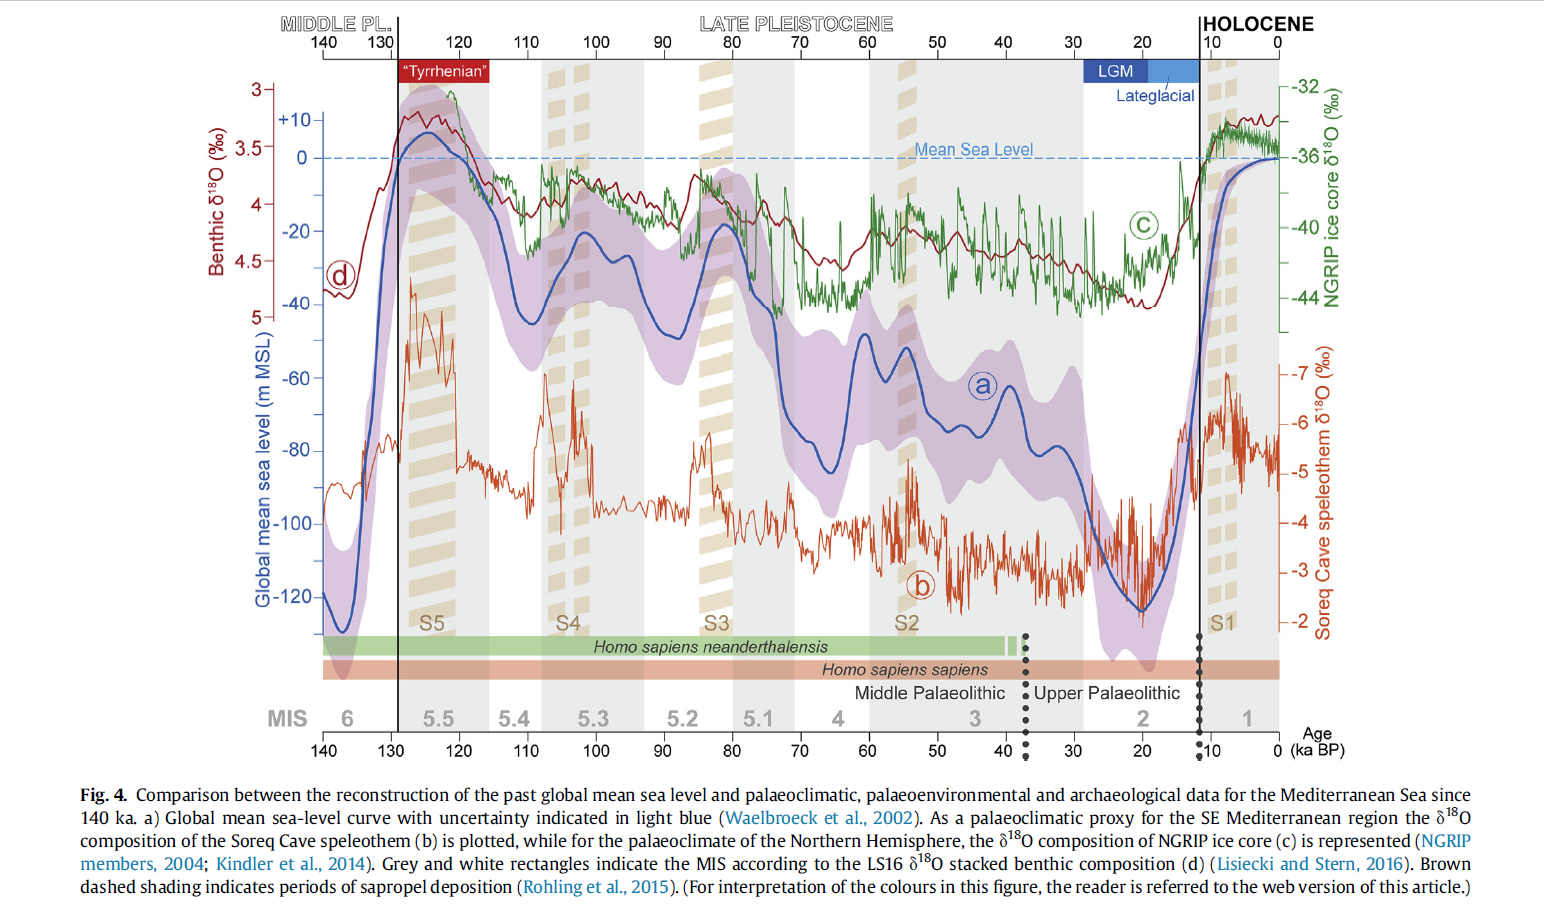
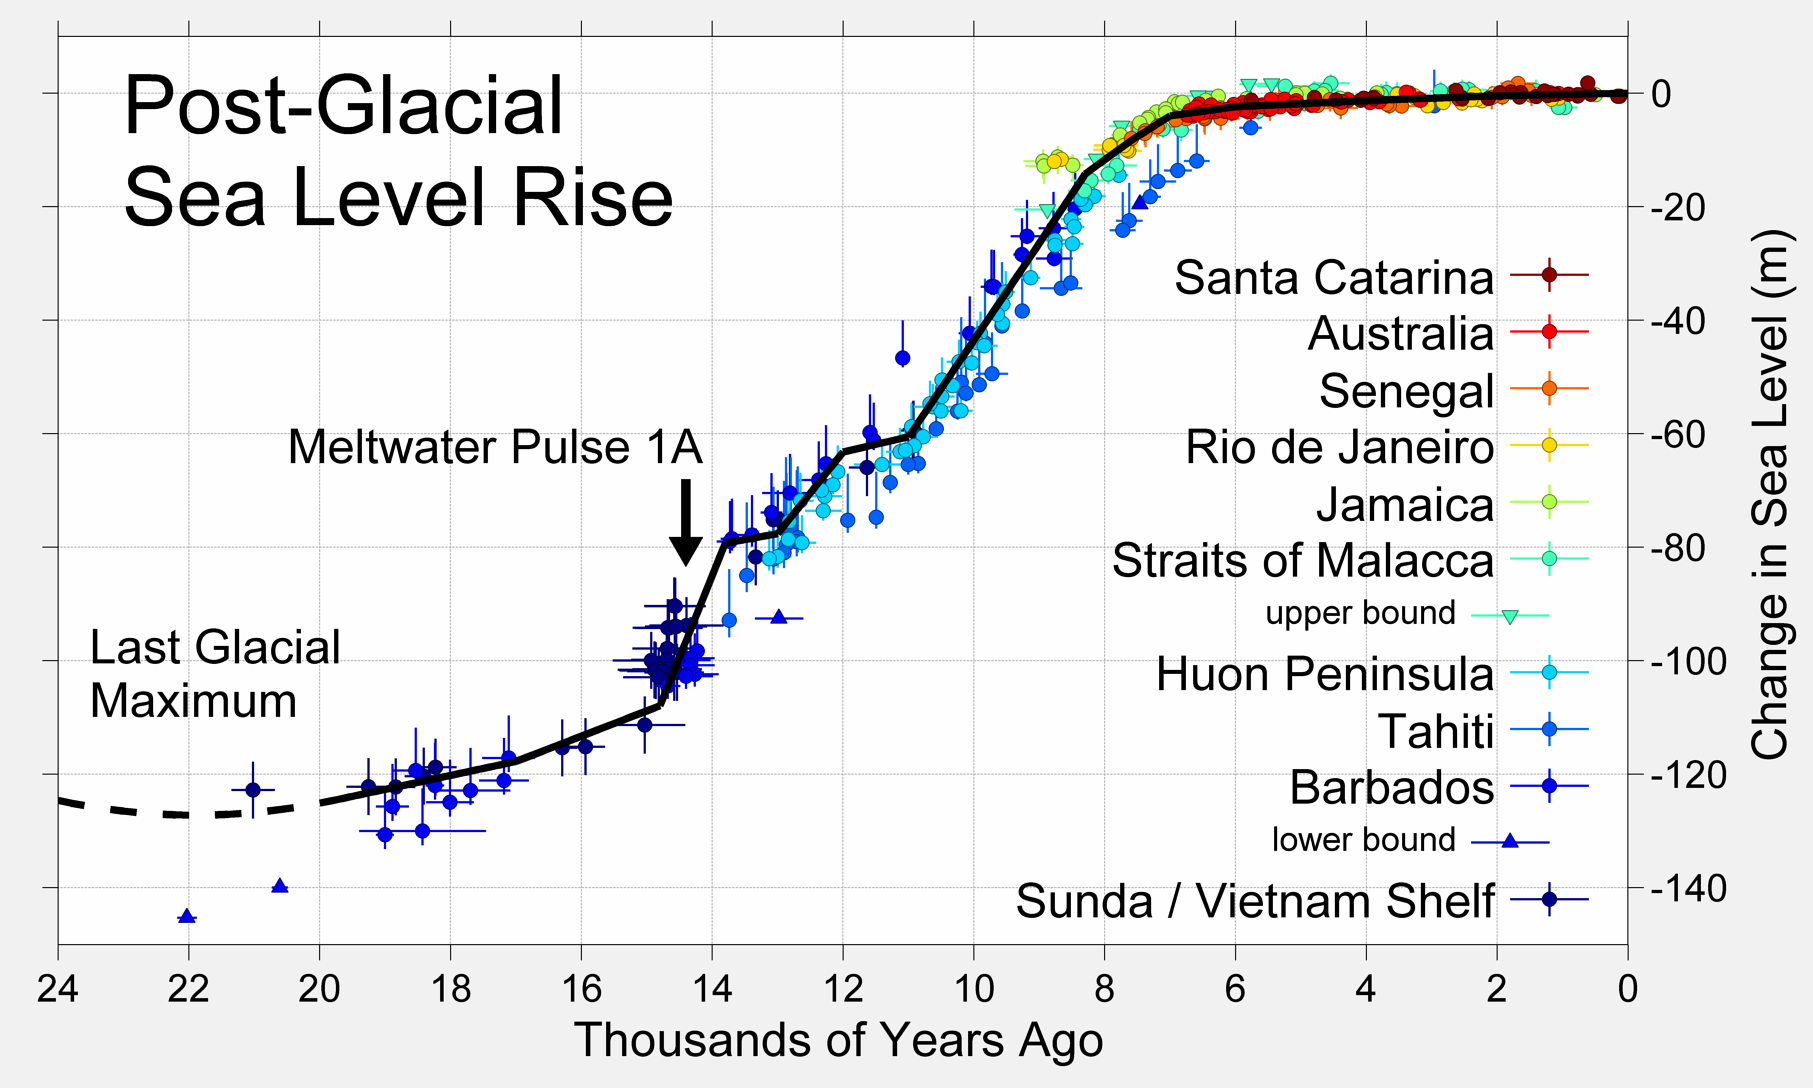
The last interglacial period occurred around 125 ka ago during the so-called Marine Isotope Stage 5.5 (or MIS 5.5, or MIS 5e, or Eemian interglacial stage) when the sea level was even ca. 5 m higher than today. After that came a ca. 100 ka long glaciation period that ended at the Last Glacial Maximum (LGM) which occurred ca. 20 ka BP when the sea level was ca. 120 m below its present Mean Sea-Level (MSL) (blue line with uncertainty margin shown in purple). The average drop in MSL over the last glaciation was therefore around 1 mm/year (or 1 m/ka), but it was a rather discontinuous process, even though stable periods of say 1000 years may have occurred. This was followed by today’s interglacial, belonging to the Holocene which starts at 11.7 ka BP, and during which the sea level gradually reached its present MSL (Benjamin et al., 2017). The rate of sea-level rise was initially quite fast, ca. 14 mm/yr, and decreased to less than 1 mm/yr after 7 ka BP and to “nearly zero” in the early 20th century.
The best known is the work of Kevin Fleming (1998). To make it short, the results are as follows, in round figures:
- Predicted for the 21st c.: around 5 to 10 mm/year, and more
depending on prediction model used;
- Observed in the 20th c.: around 1 to 2 mm/year;
- Observed in the past 2 000 years: around 0.25 mm/year,
resulting in ca. 0.50 m SLC over this period;
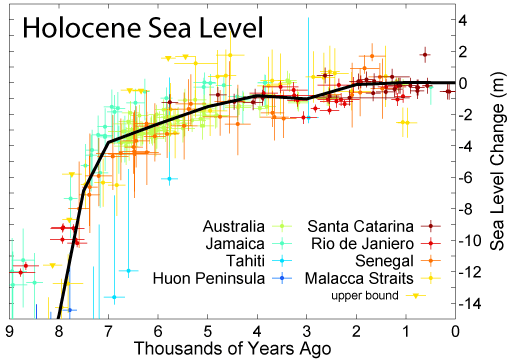
- Observed between 7 000 and 2 000 BP: around 0.7 mm/year,
resulting in ca. 3.50 m SLC over this period;
- Observed between 15 000 and 7 000 BP: around 14 mm/year,
resulting in ca. 110 m SLC over this period.
Since the rise of human civilisations around 7 000 BP, SLC has been around 4 m. This value must obviously be combined with local crustal movements which may have reached several meters uplift (e.g., Phalasarna in western Crete) or subsidence (e.g., Alexandria, Apollonia Cyrenaica, Portus Iulius near Naples, and many others) and sometimes both (Pozzuoli near Naples). Note the rate of sea-level rise varied much in time, yielding that an average rate is valid only for a limited period, and that it does not take into account sudden sea-level changes due to crustal movements. These figures are in accordance with work of Nic Flemming (1973 & 1986) who was the forerunner on this subject, and with Christophe Morhange (2013).
Sea-level index points
To build the SLC curves shown above we obviously need sea-level indicators that can be located vertically and dated in time to yield Sea-Level Index Points (SLIPs) and “limiting points”. Each SLIP defines a past position of the sea level in space and time. Limiting points provide upper or lower bounds on the past position of the sea level, e.g., terrestrial points above which sea level cannot exist, such as buildings, and marine points below which sea level cannot exist, such as deep-water fauna remains. Samples of organic material are taken from the coastline (e.g., on beachrock, on notches) or from corings into the subsoil (e.g., basal peat on top of a bedrock layer). In the case of deep corings, several SLIPs can be found on intercalated sediment layers at various depths. Conversely, archaeological data usually yield only one or two SLIPs (e.g., a Hellenistic level and a Roman level). The accuracy of each SLIP obviously depends on the type of sea-level indicator.
Geomorphological impact of SLR
Between 7500-6500 BP (5500-4500 BCE), the sea level “stabilised” around 3-4 m below present Mean Sea Level. From this time onwards, the progradation due to river sediments was stronger than marine transgression due to sea level rise, so that many deltas advanced towards the sea.
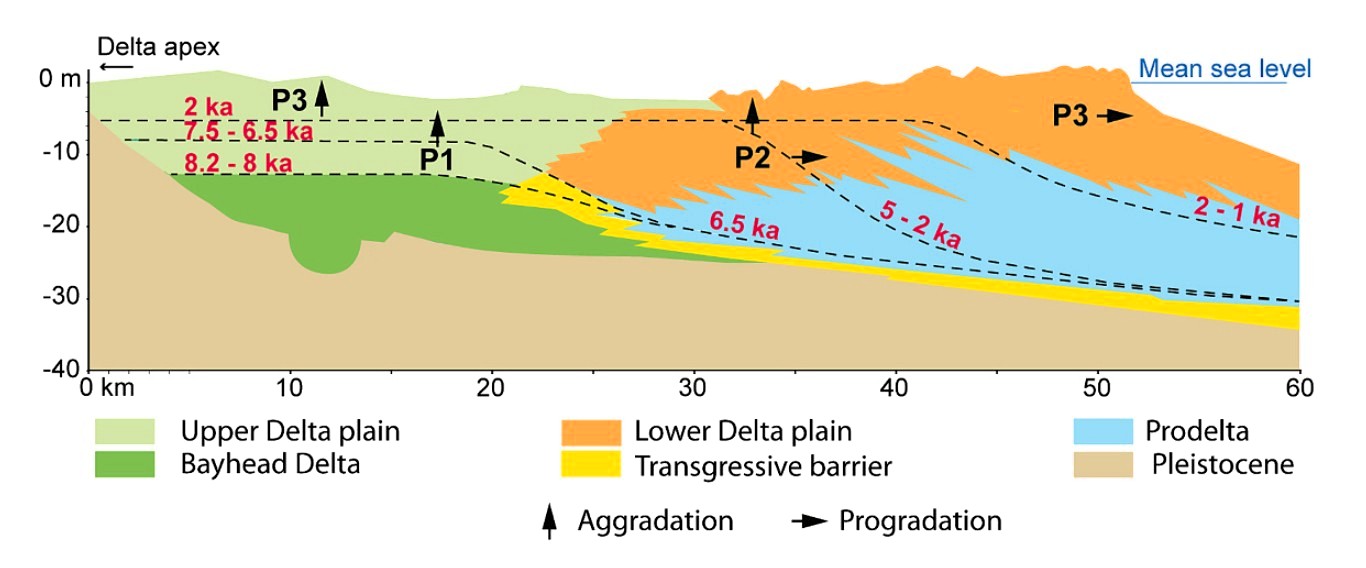
River sediments were then dispersed along the adjacent coastlines by wave action, creating new beaches or enlarging existing ones, and causing existing coves to silt up.
Sea-level indicators
Several groups of sea-level indicators are defined (Oikonomou et al. 2023; Khan et al. 2017; Vunsh et al. 2017; Evelpidou and P. A. Pirazzoli, 2014; Evelpidou, Karkani and Pirazzoli, 2014; Evelpidou and P. Pirazzoli, 2014; Auriemma and Solinas, 2009; Laborel et al. 1994; Laborel and Laborel-Deguen, 1994):
• Sedimentological indicators: mangrove peats, microbial mats from hypersaline lagoons, organic muds and peats from floodplain facies, peat containing freshwater macro fossils, calcitic muds, soil-stone crusts, marine sedimentation layers.
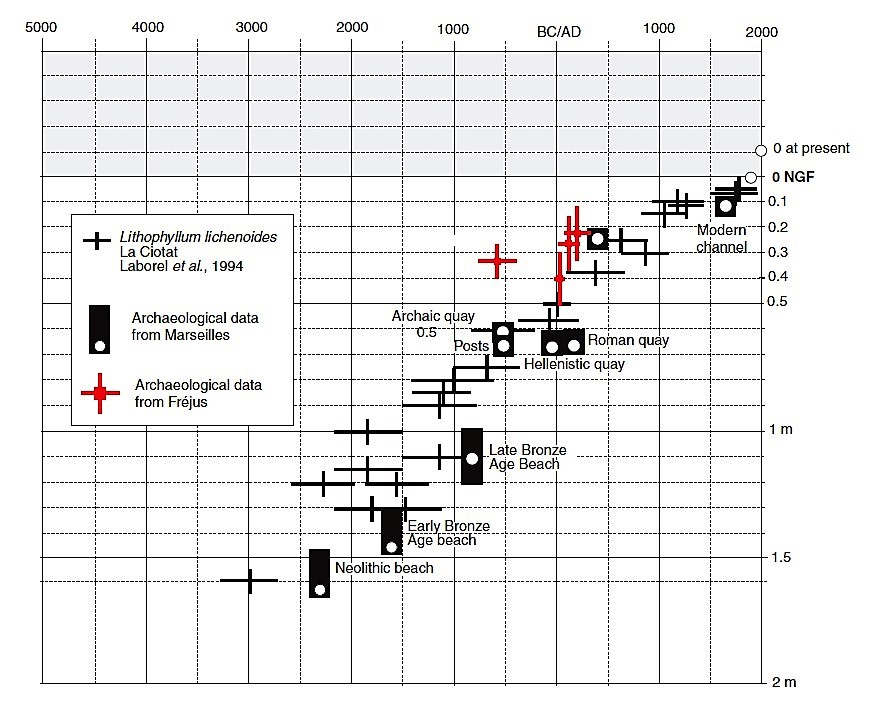
• Biological indicators living around mean sea level, such as calcareous algae growing on ledge-like bio-constructed rims on rocky cliffs (e.g., Lithophyllum lichenoides), and vermetid gastropods forming horizontal platforms (e.g., Dendropoma petraeum). Other organisms like foraminifera may provide indications about ancient marine environments.
• Geomorphological indicators such as notches and beachrock. Notches are generated by wave erosion in the intertidal zone; beachrock is the lithification of unconsolidated sediments by calcium carbonate cements in the intertidal zone of tropical and subtropical beaches.
• Archaeological indicators such as a fish tank, or the pavement level of an ancient quay that must be at a certain “functional height” above the sea level to be operational. It may be noted that the western Mediterranean has fewer Bronze Age and Iron Age harbours than the east, so archaeological indicators are mostly limited to 2–2.5 ka BP.
A major aspect is how samples of organic material are taken in the field before they are sent to the laboratory for dating. The case of basal peat taken from a deep coring seems the most straightforward case because the altitude of the sample supposed to stand for an ancient RSL is clearly defined. The case of organic material collected from rims on rocky notches and from beachrock is more difficult to analyse as these natural features may have been eroded, and/or be contaminated by younger material or by other bio-constructions or just by modern pollution. In addition, the vertical growth may be environment-dependent, depending on local temperatures (Sisma-Ventura et al., 2020). They may also depend on the exposure to offshore wave action. The correct dating of sea level is therefore depending on where exactly the sample was taken within the bio-construction, possibly leading to significant inaccuracies.
Incidentally, it must also be realised that the inward depth of tidal notches grows horizontally at a variable rate between 0.2 and 5 mm/yr depending on the carbonate rock quality and on wave action. Hence, a 0.50 m V-shaped notch requires a stable sea level for several centuries, meaning that notches with a small height are a sign of quasi-stable sea level periods, even if dating is often not easy (Evelpidou and P. A. Pirazzoli, 2014; Evelpidou, Karkani and Pirazzoli, 2014; Evelpidou and P. Pirazzoli, 2014).
Radiocarbon dating
Radiocarbon dating (14C age) is by far the most common method of dating organic samples. After pre-treatment of the sample to remove carbon contaminants, the residual carbon-14 content can be determined either by measuring the sample’s radioactivity (conventional dating), or by counting the number of remaining 14C atoms (AMS dating). The measurement results are expressed in years BP with an associated error. These ages must then be calibrated to sidereal years (cal BP or cal BCE/CE) with a 2 σ confidence interval using the IntCal20 and Marine20 calibration curves for terrestrial (freshwater mangrove and peat) and marine samples (marine gastropods and corals), respectively (a calibration program is available at: http://calib.org/calib/calib.html ), (Khan et al. 2017).
GIA modelling
According to Sivan et al. (2001), “local sea-level curves reflect global eustatic changes, regional isostatic adjustments of the crust to changing ice and ocean volumes and tectonically controlled crustal movements”. For this reason, we call them Relative Sea-Level Change (RSLC), and it is obviously difficult to differentiate Eustatic Sea-level changes (ESL changes) from crustal movements of the Earth as our measuring instruments stand on the Earth. Coastal submergence results from rising sea levels and/or ground subsidence, so that we have two variables and only one equation which cannot be solved without further assumptions. A typical approach is to assume that a zone is tectonically stable and to deduce the BSL from RSL measurements. Conversely, another approach is to accept some “predicted” BSL to conclude anything about the movements of the Earth’s crust in a given area. Proving the correctness of the assumptions in each approach is challenging.
A more comprehensive definition, including more variables, is provided by Khan et al. (2019) by the following schematised sea-level equation:
RSLC = ESL + GIA + Static equilibrium + Tectonics + Local factors
where:
- RSLC is the Relative Sea-Level Change, or vertical coastal submergence.
- ESL refers to changes in the mass of the ocean due to melting (or growth) of land-based ice, and to ocean water density changes from temperature and salinity variations.
- GIA (Glacial Isostatic Adjustment) is the response of the solid Earth and gravity field to ice mass redistribution during a glacial cycle.
- Static equilibrium RSL changes are interrelated to GIA and are associated with regional gravitational, deformational, and rotational processes in response to exchanges of mass between the cryosphere and the ocean (hydro-isostatic adjustment).
- Tectonics inducing vertical land motion can contribute significantly to RSL change on some coastlines.
- Local (to regional) scale factors include subsidence due to the compaction of shallow sediments (deltaic sediment loading, and groundwater and hydrocarbon extraction, both leading to subsidence, and non-stationary tides that may also contribute to apparent RSL changes).
This equation shows that many factors are involved and that virtually nothing is stable, as even gravitation and oceanic current patterns are influenced by the changing ice sheets. The only stable reference point is the centre of the Earth.
A rough first approximation would be to consider that both water and earth crust are moving independently, so that the average of all measured sea level movements on the entire Mediterranean basin would reflect the BSL change, while local deviations from this average would reflect the local crust movements (e.g., Crete). If this simple method is applied to our data base, including over 600 Mediterranean coastal sites providing information about RSLC, we find an average BSL change ranging between 0 and 1 m over the past 2000 years. This approach is theoretically incorrect as it is known that when glaciers melt, their underground rises and adjacent areas sink, depending on the underlying geology/rheology. This process is also called “post-glacial rebound” and is part of the Glacial Isostatic Adjustment (GIA).
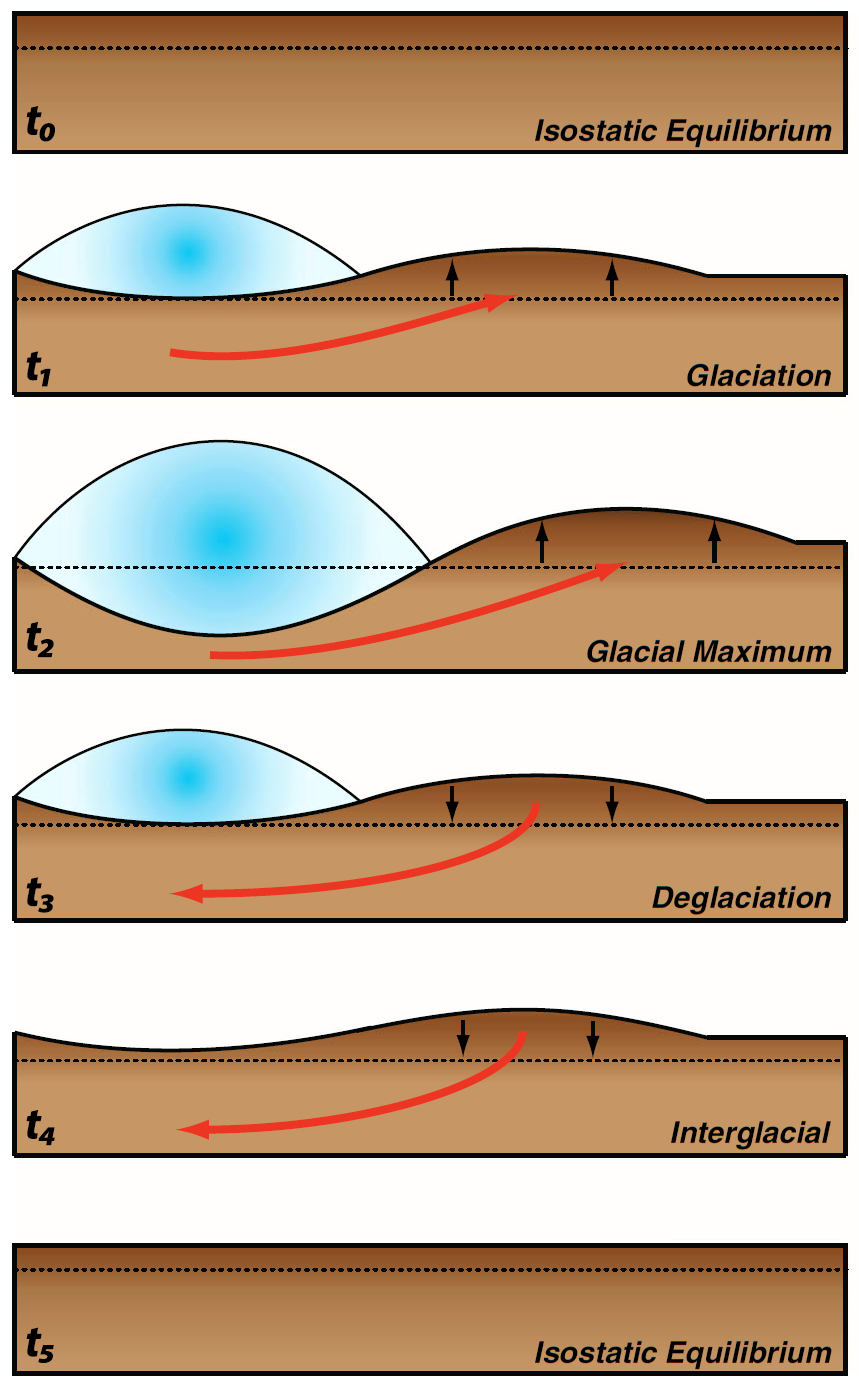
The Earth’s crust and mantle are reacting like a water mattress, on which some areas have been relieved of the weight of ice sheets, and nearby areas compensate by a flow of mantle material (Khan et al., 2015). Even though this diagram is simplified, it shows water and earth do not move independently of each other, and we need more complex modelling of the interactions between the two (Spada, 2023; Lambeck, 2005, 2014).
Such numerical modelling of the Earth’s mantle and ice sheets to describe spatio-temporal RSLC was carried out by Kurt Lambeck through numerous publications. He was followed-up by several other researchers and a comprehensive overview of these modelling approaches is provided by Whitehouse (2018).
Studies are still ongoing, but we get gradually convinced that possibly most, if not all, of the Relative Sea-Level Change over the last 2000 years is due to crustal movements rather than to Eustatic Sea-Level changes.
Work on subsidence is therefore important.
References
Anthony, E., et al. (2025), “A 7000-year record of human influence on Global River Deltas: Geomorphology, stratigraphy, the Anthropocene overprint and future”, Earth-Science Reviews, 271, 1–35. https://doi.org/10.1016/j.earscirev.2025.105302
Auriemma, R. and Solinas, E. (2009) ‘Archaeological remains as sea level change markers: A review’, Quaternary International, 206(1), pp. 134–146.
Benjamin, J., Rovere, A., Fontana, A., Furlani, S., Vacchi, M., Inglis, R., Galili, E., Antonioli, F., Miko, S., Mourtzas, N., Felja, I., Meredith-Williams, M., Goodman-Tchernov, B., Kolaiti, E., Anzidei, M. and Gehrels, R. (2017) ‘Late Quaternary sea-level changes and early human societies in the central and eastern Mediterranean Basin: An interdisciplinary review’, Quaternary International, 449.
Evelpidou, N., & Karkani, A., 2019, “Archaeology and Sea-Level Change”, in: Encyclopedia of Coastal Science, Springer, (7 p).
Evelpidou, N. and Pirazzoli, P. (2014) ‘Sea-Level Indicators’, in Environmental Management and Governance: Advances in Coastal and Marine Resources, C.W. Finkl, C. Makowski (edts). Springer International Publishing, pp. 291–311.
Evelpidou, N. and Pirazzoli, P.A. (2014) ‘Holocene relative sea-level changes from submerged tidal notches: a methodological approach’, Quaternaire. Revue de l’Association française pour l’étude du Quaternaire, (vol. 25/4), pp. 313–320.
Fleming, K., et al., 1998, “Refining the eustatic sea-level curve since the Last Glacial Maximum using far- and intermediate-field sites”, Earth and Planetary Science Letters 163, (p 327–342).
Flemming, N.C., Webb, C.O., 1986, “Tectonic and eustatic coastal changes during the last 10,000 years derived from archaeological data”, Z. Geomorphol. Suppl. 62, (p 1–29).
Flemming, N.C., Czartoryska, N.M.G., Hunter, P.M., 1973, “Archaeological evidence for eustatic and tectonic components of relative sea level in the South Aegean”, 23rd Symposium of the Colston Research Society, Bristol, 1971, Pap. 23, (p 1-63).
Fontana, A., Vinci, G., Tasca, G., Mozzi, P., Vacchi, M., Bivi, G., Salvador, S., Rossato, S., Antonioli, F., Alessandra, A., Bresolin, M., Mario, F. and Hajdas, I. (2017) ‘Lagoonal settlements and relative sea level during Bronze Age in Northern Adriatic: Geoarchaeological evidence and paleogeographic constraints’, Quaternary International, 439.
Gambash, G., 2024, To Build or Not to Build: Considerations of Coastal Development in the Ancient Southern Levant, J. Mar. Sci. Eng., 12, 803, 1-12.
Khan, N., Horton, B., Engelhart, S., Rovere, A., Vacchi, M., Ashe, E., Törnqvist, T., Dutton, A., Hijma, M. and Shennan, I. (2019) ‘Inception of a global atlas of sea levels since the Last Glacial Maximum’, Quaternary Science Reviews, 220, pp. 359–371.
Khan, N., Ashe, E., Horton, B., Dutton, A., Kopp, R., Brocard, G., Engelhart, S., Hill, D., Peltier, W., Vane, C. and Scatena, F. (2017) ‘Drivers of Holocene sea-level change in the Caribbean’, Quaternary Science Reviews, 155, pp. 13–36.
Khan, N., Ashe, E., Shaw, T., Vacchi, M., Walker, J., Peltier, W., Kopp, R. and Horton, B. (2015) ‘Holocene Relative Sea-Level Changes from Near-, Intermediate-, and Far-Field Locations’, Current Climate Change Reports, 1.
Laborel, J. and Laborel-Deguen, F. (1994) ‘Biological Indicators of Relative Sea-Level Variations and of Co- Seismic Displacements in the Mediterranean Region’, Journal of Coastal Research, 10(2), pp. 395–415.
Laborel, J., Morhange, C., Lafont, R., Campion, J.L., Laborel-Deguen, F. and Sartoretto, S. (1994) ‘Biological evidence of sea-level rise during the last 4500 years on the rocky coasts of continental southwestern France and Corsica’, Marine Geology, 120(3–4), p. 203.
Lambeck, K., Anzidei, M., Antonioli, F., Benini, A., Verrubbi, V., 2018, “Tyrrhenian sea level at 2000 BP: evidence from Roman age fish tanks and their geological calibration”, Rendiconti Lincei. Scienze Fisiche e Naturali, Satellite Geodetic Positioning for Geosciences, Roma, 2017, (12 p).
Lambeck, K. & Purcell, A., 2005, “Sea-level change in the Mediterranean Sea since the LGM: model predictions for tectonically stable areas”, Quaternary Science Reviews 24, (p 1969–1988).
Morhange, C., 2013, et al., “Relative Sea-Level Changes During Roman Times in the Northwest Mediterranean: The 1st Century A.D. Fish Tank of Forum Julii, Fréjus, France”, Geoarchaeology: An International Journal, 28, (p 363–372).
Salel, T., Flaux, C., Bruneton, H., Degeai, J.-P., Devillers, B. and Lefèvre, D. (2020) ‘Changements du niveau marin relatif à l’Holocène ancien et moyen sur la côte du golfe du Lion’, Quaternaire. Revue de l’Association française pour l’étude du Quaternaire, (31/1), pp. 33–44.
Sisma-Ventura, G., Antonioli, F., Silenzi, S., Devoti, S., Montagna, P., Chemello, R., Shemesh, A., Yam, R., Gehrels, R., Dean, S., Rilov, G. and Sivan, D. (2020) ‘Assessing vermetid reefs as indicators of past sea levels in the Mediterranean’, Marine Geology, 429, p. 106313.
Sivan, D., et al., 2001, “Holocene sea-level changes along the Mediterranean coast of Israel, based on archaeological observations and numerical model”, Palaeogeography, Palaeoclimatology, Palaeoecology 167, (p 101-117).
Spada, G. & Melini, D., 2023, “New estimates of ongoing sea level change and land movements caused by Glacial Isostatic Adjustment in the Mediterranean region”, Geophysical Journal International, Vol. 229, Issue 2, May 2022, (p 984-998).
Vacchi, M., et al., 2016, “Multiproxy assessment of Holocene relative sea-level changes in the western Mediterranean: Sea-level variability and improvements in the definition of the isostatic signal”, Earth-Science Reviews 155, (p 172-197).
Vella, C. and Provansal, M. (2000) ‘Relative sea-level rise and neotectonic events during the last 6500yr on the southern eastern Rhône delta, France’, Marine Geology, 170, pp. 27–39.
Whitehouse, P., 2018, Glacial Isostatic Adjustment modelling: historical perspectives, recent advances, and future directions, Earth Surface Dynamics Discussions, (6), (p 401–429).
Yasur-Landau, A., et al., 2024, Sea-Level Changes and the Location of the ‘Missing’ Hellenistic and Roman Harbours at Tel Dor, Israel, Int. J. Naut. Archaeol., 53, 1–20.
Yasur-Landau, A., et al., 2021, “New relative sea-level (RSL) indications from the Eastern Mediterranean: Middle Bronze Age to the Roman period (~3800-1800 y BP) archaeological constructions at Dor, the Carmel coast, Israel”, PLoS ONE 16(6): e0251870, (25 p).